How Should a Bank Measure Entity Resolution Accuracy in 2026? Pairwise Precision, Cluster Metrics and the Targets to Write Into a PoC

TL;DR: A bank should measure entity resolution accuracy at three levels: pairwise precision and recall for each link, cluster metrics for each customer profile, and candidate recall for the pairs the matcher never compared. Write the PoC target on profiles, as a false-merge rate and a missed-link rate per source slice, with sample size and confidence stated.
Book a Demo · Try Tilores Studio (Free)
On this page
- How should a bank measure entity resolution accuracy?
- Why can the same result win on pairs and lose on profiles?
- Why does high pairwise precision hide contaminated customers at bank scale?
- Why does recall stop at candidate generation?
- Why are two vendors’ accuracy numbers rarely comparable?
- How should a bank run the measurement, step by step?
- How large must the PoC sample be, and what target should the bank set?
- Frequently asked questions
- Sources
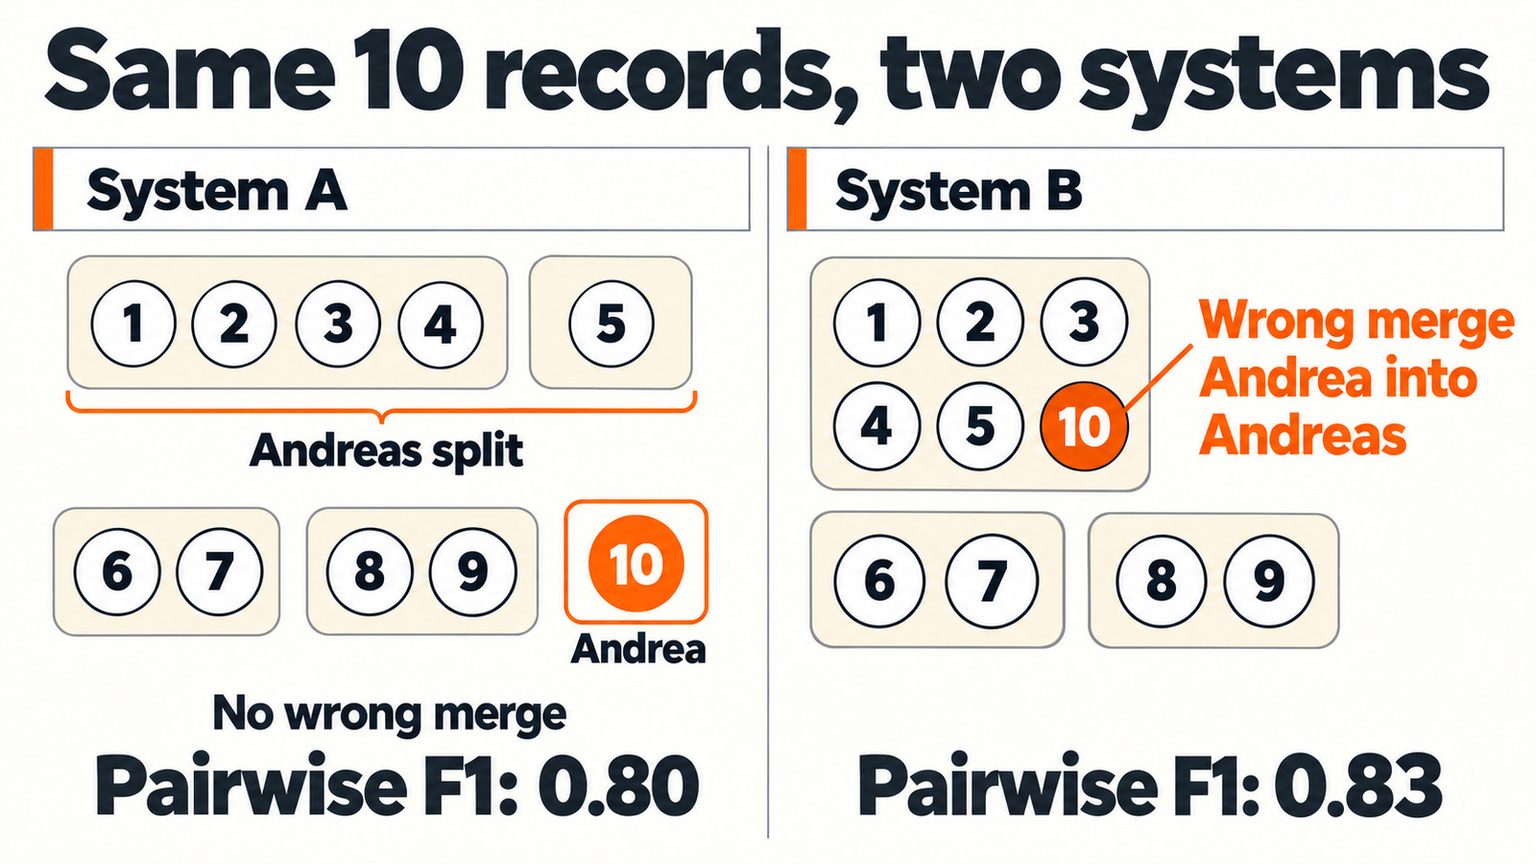
A vendor’s PoC read-out says 98% precision, and the slide looks like an answer. It is not one yet, because nobody has said what was counted: record pairs, finished customer profiles or single records, and on whose labels. On ten ordinary records, pairwise F1 ranks first the system that files a household member’s record inside another customer’s profile.
A bank pays for the two errors differently. A missed match leaves one customer split across two profiles. A wrong match puts one person’s data inside another person’s profile, which our guide to wrong customer matches treats as a possible personal data breach.
So our position is that the number a bank signs should count profiles. Pairwise precision and recall still belong in the report, beside the profile figures and never in their place.
How should a bank measure entity resolution accuracy?
Measure it at three levels, and write the contract on the level where customers are harmed. Pairwise precision and recall score each link. Cluster metrics score each finished customer profile. Candidate recall counts how many true matches ever reached the matcher.
The report needs all three, but the target belongs on profiles, because a profile is what a customer or a supervisor sees, and because pair counts can put two systems in the wrong order. Ten records show how.
Why can the same result win on pairs and lose on profiles?
Pair counting gives a large profile far more weight than a small one, so a system can make a wrong link and still finish ahead on pairwise F1.
How are pairwise precision and recall calculated?
Pairwise scoring turns every cluster into the pairs inside it, then compares the system’s pairs with the true pairs. Precision is the share of predicted pairs that are true, and it counts the first error Fellegi and Sunter named in 1969: linking records that are not a match. Recall is the share of true pairs the system found, and it counts the second: failing to link records that are. A cluster of n records holds n(n-1)/2 pairs, so five records give ten pairs, not five.
What does a ten-record example show?
Ten records belong to four real customers. Customer P is Andreas Müller, with five records in five systems; his loan record carries a new postcode after a house move. Customer S is Andrea Müller, a household member at the old address, who must never merge with him. There are 12 true pairs: ten inside P, one inside Q and one inside R.
| Record | Source system | Name as stored | Postcode | True customer |
|---|---|---|---|---|
| 1 | CRM | Andreas Müller | 10115 | P |
| 2 | Core banking | Andreas Mueller | 10115 | P |
| 3 | Card | A. Müller | 10115 | P |
| 4 | App | Müller, Andreas | 10115 | P |
| 5 | Loan | Andreas Müller | 80331 | P |
| 6, 7 | CRM, card | Katarina Nowak, K. Nowak | 50667 | Q |
| 8, 9 | CRM, app | Jonas Weber, J. Weber | 20095 | R |
| 10 | CRM | Andrea Müller | 10115 | S |
System A returns {1, 2, 3, 4}, {5}, {6, 7}, {8, 9} and {10}. It predicts 8 pairs and all 8 are true, so precision is 1.00. It found 8 of 12 true pairs, so recall is 0.67 and F1 is 0.80. It missed the moved loan record and merged nobody wrongly.
System B returns {1, 2, 3, 4, 5, 10}, {6, 7} and {8, 9}. It predicts 17 pairs and 12 are true, so precision is 0.71, recall is 1.00 and F1 is 0.83. Its one wrong link, between Andrea’s record and Andreas’s profile, creates five wrong pairs, because the profile now holds six records. Pairwise F1 still ranks System B first.
What changes when you score the profile instead?
Cluster metrics judge the finished profile, and on these ten records they reverse the ranking. Report three, the last as our bake-off guide defines it:
- Exact cluster precision is the share of predicted clusters that equal a true cluster, and exact cluster recall is the share of true clusters reproduced whole. One stray record spoils a profile, so the measure is harsh but easy to read.
- B-cubed compares each record’s predicted cluster with its true cluster: precision asks how much of the predicted cluster belongs to the record’s customer, and recall how much of the customer’s true profile it captured. Binette and colleagues average within each customer and then across customers, so a one-record customer counts as much as a five-record one.
- False-merge and missed-link rates count profiles: predicted multi-record clusters that hold more than one real customer, and real multi-record customers who are split.
| Measure on the ten records | System A | System B | Ranks first |
|---|---|---|---|
| Pairwise precision, recall, F1 | 1.00, 0.67, 0.80 | 0.71, 1.00, 0.83 | B on F1 |
| Exact cluster precision, recall, F1 | 0.60, 0.75, 0.67 | 0.67, 0.50, 0.57 | A |
| B-cubed precision, recall, F1 | 1.00, 0.92, 0.96 | 0.75, 1.00, 0.86 | A |
| Contaminated profiles (false merges) | 0 of 3 | 1 of 3 | A |
| Split customers (missed links) | 1 of 3 | 0 of 3 | B |
Pairwise F1 picks System B, while exact-cluster, B-cubed and false-merge scores pick System A; only the missed-link count favours B. Menestrina, Whang and Garcia-Molina found that such conflicts occur often, because each measure scores a different aspect of the result. A bank that treats a wrong merge as a data incident should choose A, and its contract can only say so if it names the unit.
Why is a single F1 score a weak basis for a target?
The flip shows the first weakness: F1 hides which error you bought. Hand and Christen show that the F-measure is a weighted sum of precision and recall whose weights depend on the linkage method, so the system sets the trade-off and not the bank. The UK Government’s guidance on linkage quality advises against comparing linkage quality with the F-measure, because the score depends on each classifier’s match rate.
The test mix moves it too: in a 2026 preprint on the OpenSanctions Pairs benchmark, a predictor that answers match for every pair scores F1 = 0.870, because 76.9% of the labelled pairs are matches. Report precision and recall separately, at every level.
New posts on entity resolution, identity data and AI. No spam, unsubscribe any time.
Why does high pairwise precision hide contaminated customers at bank scale?
At bank scale the gap between pairs and profiles widens, because pair counts rise with the square of cluster size and a few large clusters set the score. Barnes’s practitioner survey notes that mismatching two singletons barely moves pairwise metrics, while joining or splitting two large clusters moves them a great deal.
Where nearly every customer has one or two records, a pair and a profile are almost the same thing and pairwise scores do little harm. Large corporate groups change that. On illustrative assumptions of our own, take 100,000 two-record customers and 100 corporate groups of 200 records. The true pair count is 100,000 plus 100 times 19,900, which is 2,090,000. Now suppose 1,000 pairs of two-record customers are each merged into one four-record profile, adding 4 false pairs per merge, or 4,000 in all.
Pairwise precision is 2,090,000 divided by 2,094,000, which is 99.81%, with recall at 100%. Yet 2,000 of 100,100 customers, or 2.0%, now share a profile with a stranger. The headline describes the corporate groups, not the typical customer.
One wrong link can follow a person for years. From 1996, a credit bureau listed another woman’s bad debts on Judy Thomas’s file: a shared birth year, similar first names, and Social Security numbers one digit apart. CBS News reported in 2002 that she spent about seven years trying to correct it and that she won a $5.3 million award in a federal case. No pair-level average would have shown that link.
Why does recall stop at candidate generation?
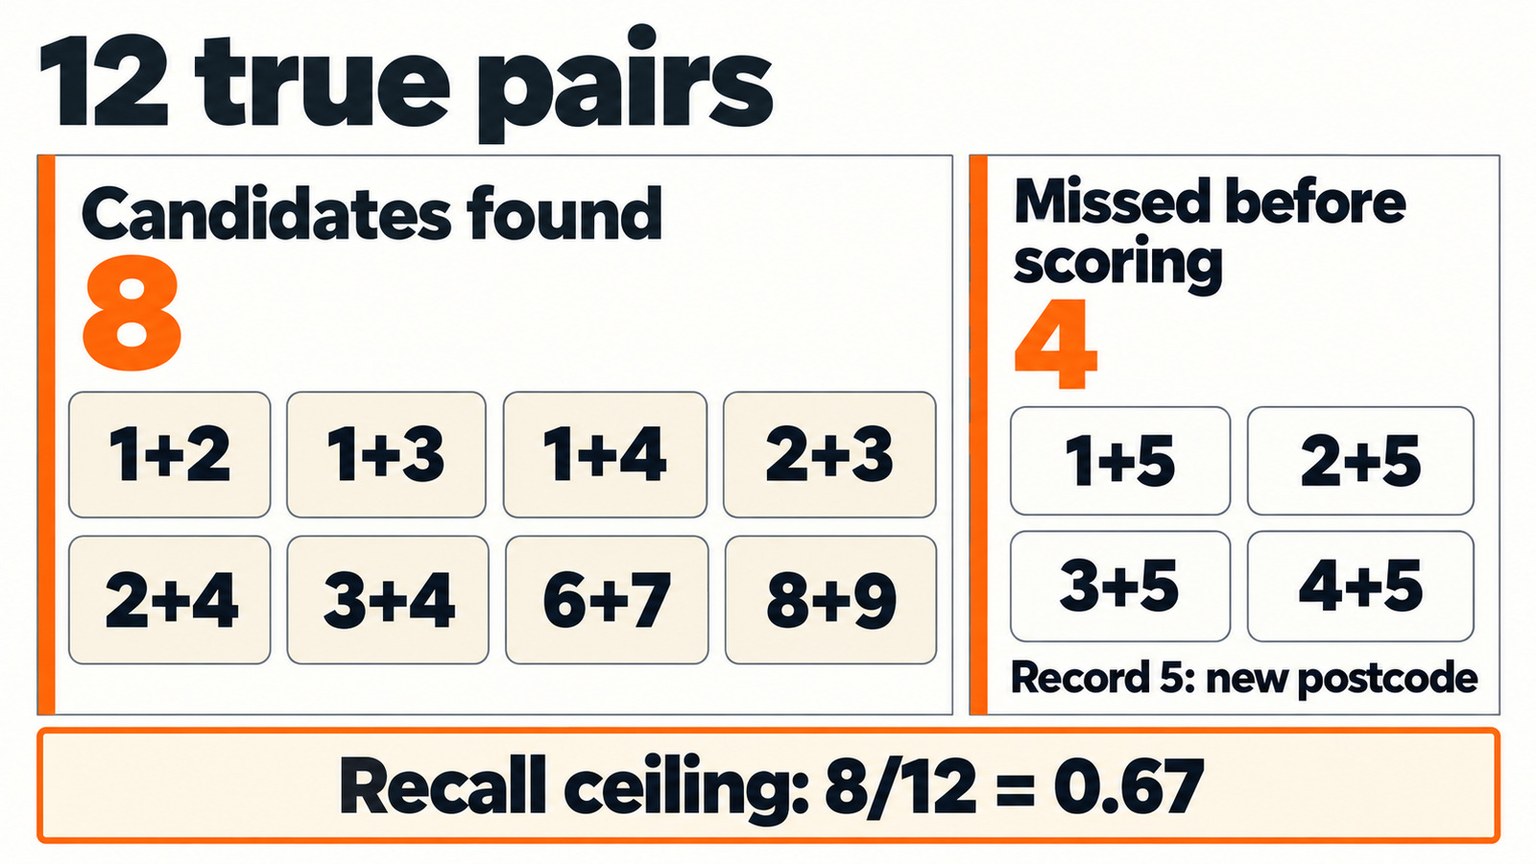
Pairwise precision hides false merges, and recall hides a blind spot of its own: the pairs the matcher never compared. A matcher cannot score a pair it never compares. Candidate generation, often called blocking, decides which pairs reach the matcher, so it sets a ceiling on recall. Papadakis and colleagues define pair completeness as the share of true duplicate pairs that survive into the candidate set.
In the ten records, a postcode key groups records 1 to 4 with record 10, but record 5 carries the new postcode and never meets its own profile. Eight of 12 true pairs reach the matcher, so pair completeness is 0.67, and System A’s recall of 0.67 is that ceiling. No threshold change lifts it, and a vendor that reports only recall at its threshold cannot show you the cause.
How should a bank test for missed links?
Reviewing a system’s links finds false links far better than missed ones. The UK Government’s guidance says clerical review is more useful for estimating precision than recall, and points to positive controls, known matches placed in the data, for missed links. Seed the holdout with known matches that differ in postcode, surname, spelling and script, then ask each vendor for candidate recall, recall at the operating threshold, and recall after human review.
Why are two vendors’ accuracy numbers rarely comparable?
Two vendors’ figures compare only when every choice above matches (the unit, the share of easy matches, the labels, the threshold, the sample and the candidate step), and read-outs rarely state them. Binette and colleagues report that pairwise precision on benchmark data sets tends to be over-optimistic and can reverse the ranking of two algorithms once they run on the full population.
| Ask the vendor to state | Why the number moves without it |
|---|---|
| The unit counted: pair, cluster or record | One wrong link costs five pairs in the ten-record example but one profile. |
| The share of easy matches in the test set | A trivial predictor scores F1 = 0.870 when 76.9% of pairs are matches. |
| Who labelled, and how unresolved cases were scored | Dropping unresolved pairs removes the hard cases; our ground-truth guide covers the policy. |
| The operating threshold and review band | Precision and recall trade against each other at every threshold. |
| How the sample was drawn, with an interval | A sample of only linked pairs estimates precision and says nothing about recall. |
Nor can the bank hand this reading to the vendor. The PRA’s SS1/23 covers models developed in-house or externally, vendor models included, so a vendor’s accuracy claim does not replace the bank’s own validation on its own labels. The bank runs the measurement itself.
How should a bank run the measurement, step by step?
The bank keeps the holdout, the labels and the arithmetic, so it controls the metrics whichever vendor wins.
- Freeze the holdout and name the unit. Fix the records, label policy and units before any vendor sees a result.
- Convert every output to clusters. Ask each vendor for a record-to-cluster file, and compute every metric from that file.
- Report candidate recall. Count the true pairs that reached the matcher before any threshold applied.
- Count profiles. Give false-merge and missed-link rates with numerator, denominator and slice.
- State the uncertainty. Add an interval to every rate, sized as in the next section.
Those steps need three things from any vendor: a cluster file per run, a reason for every link, and targets fixed in advance. Our paid PoCs run on a sample extract of the bank’s data, with precision and recall targets agreed up front, at least two refinement cycles, and an exportable rule configuration the bank keeps. We publish no single accuracy figure, because the result depends on the bank’s labels, sources and slices.
We store each match as a graph edge that records the rule that created it, so a contaminated profile found in step 4 traces to one link and one rule. Our consistency rules stop a conflicting date of birth or tax identifier from forming an entity however strong the other evidence is, which targets the false merge directly. Our rule simulation previews how selected pairs behave before you deploy. Our guides to the seven PoC inputs and agreeing matching rules cover the working process.
We are the wrong answer for a single table of a few thousand records with a stable unique key, because a join on that key needs no resolution engine. When customers sit in several systems without a shared key, our Tilores Studio runs locally with up to 100,000 records and gives you the same GraphQL API we run in the cloud, so you can download Tilores Studio and score an approved sample before a PoC begins, or book a demo to plan the targets.
How large must the PoC sample be, and what target should the bank set?
The target has one last constraint: the sample must be able to prove it, and a hand-labelled extract is often too small. By the rule of three, zero errors in n independent cases put the 95% upper bound on the error rate at about 3 divided by n (the exact bound is 1 minus 0.05 to the power 1/n).
Applied to false merges, 300 reviewed multi-record clusters with none contaminated show a rate under 1% at 95% confidence. Under 0.1% takes 3,000 clusters and under 0.01% takes 30,000. A bank that tolerates 200 contaminated profiles among 2,000,000 customers is asking for 0.01%, which a PoC extract cannot prove. Set a target the sample can demonstrate, and monitor the tighter figure in production as in our post-deployment monitoring guide.
Sanctions, PEP and adverse-media screening needs its own target, and there the ranking can rightly turn back toward the high-recall system, because a missed listed person costs more than an extra alert. The OpenSanctions preprint’s RegressionV1 baseline has near-perfect recall and many false positives at a threshold of 0.15, which the authors link to a preference for catching every potential match at the cost of analyst review. Entity resolution does not replace screening; it hands the workflow one resolved identity with its aliases. Set recall high for that slice and keep the false-merge ceiling low for onboarding. OpenSanctions publishes PEP datasets for test fixtures, and commercial use needs a data licence.
What sentence belongs in the statement of work?
On the bank’s blind holdout, labelled under the bank’s written policy, the configuration shall achieve a false-merge rate of at most [X]% of predicted multi-record clusters, a missed-link rate of at most [Y]% of multi-record customers, and candidate recall of at least [Z]%, each reported per source slice with numerator, denominator and 95% interval. Pairwise precision and recall are reported alongside these figures and never in place of them.
The bank sets X, Y and Z from its own risk appetite, slice by slice. A vendor that supplies them has set its own examination.
Frequently asked questions
What is the difference between pairwise and cluster precision?
Pairwise precision is the share of predicted record pairs that are true, and cluster precision is the share of predicted profiles that are right. One wrong link in a large profile costs many pairs but one profile, so the two can name different winners.
Which single metric should a bank put in a PoC contract?
No single metric is enough. Write the target as a false-merge rate and a missed-link rate per source slice, add candidate recall, and report pairwise precision and recall alongside, each with a numerator, a denominator and an interval.
What is candidate recall?
Candidate recall, also called pair completeness, is the share of true matching pairs that reach the matcher after blocking. It caps every later recall figure, because no threshold can find a pair that was never compared.
How many labelled clusters does a PoC need?
It depends on the target. By the rule of three, 3,000 reviewed multi-record clusters with no false merge show a rate under 0.1%, and under 0.01% needs 30,000, so pick a target the sample can prove and monitor the rest in production.
Sources
- Tilores: One Resolved Data Layer, Tilores.
- Download Tilores Studio, Tilores.
- How to Run an Entity Resolution Vendor Bake-Off With Real Bank Data, Tilores.
- How to Build a Ground-Truth Dataset for Entity Resolution in 2026, Tilores.
- Entity Resolution Proof of Concept: 7 PoC Inputs a Bank Needs in 2026, Tilores.
- How a Bank and Its Entity Resolution Vendor Agree on Matching Rules Before a PoC, Tilores.
- Is a Wrong Customer Match a Reportable GDPR Incident, and What Must a Bank Document?, Tilores.
- How to Monitor Entity Resolution Accuracy After Deployment: 7 Metrics for 2026, Tilores.
- A Theory for Record Linkage, Ivan P. Fellegi and Alan B. Sunter, Journal of the American Statistical Association, Vol. 64, No. 328 (1969).
- Evaluating Entity Resolution Results, David Menestrina, Steven Euijong Whang and Hector Garcia-Molina, Proceedings of the VLDB Endowment, Vol. 3 (2010).
- A Practioner’s Guide to Evaluating Entity Resolution Results, Matt Barnes, Carnegie Mellon University (2015).
- A note on using the F-measure for evaluating record linkage algorithms, David Hand and Peter Christen, Statistics and Computing (2018).
- Quality assessment in data linkage, James Doidge, Peter Christen and Katie Harron, GOV.UK, Office for National Statistics and Government Analysis Function.
- How to Evaluate Entity Resolution Systems: An Entity-Centric Framework with Application to Inventor Name Disambiguation, Olivier Binette and colleagues, arXiv preprint 2404.05622 (2024).
- A Survey of Blocking and Filtering Techniques for Entity Resolution, George Papadakis, Dimitrios Skoutas, Emmanouil Thanos and Themis Palpanas, arXiv 1905.06167 (2020).
- OpenSanctions Pairs: A Large-Scale Dataset for Pairwise Entity Matching, Chandler Smith, Magnus Sesodia, Friedrich Lindenberg and Christian Schroeder de Witt, arXiv preprint 2603.11051, version 2 (25 August 2026).
- Politically Exposed Persons Datasets, OpenSanctions.
- Mistaken Identity In Credit Report, Rome Neal, CBS News (31 July 2002).
- SS1/23: Model Risk Management Principles for Banks, Bank of England Prudential Regulation Authority.
- Video: One Woman Spent Seven Years Fighting Another Person’s Debt on Her Credit Report, Schmitdy Gadget, YouTube.
See what resolved entity data does for your business — and your AI.